With Joomag's new analytics you can see your most popular collections or publications and analyze them. Here's how to do that:
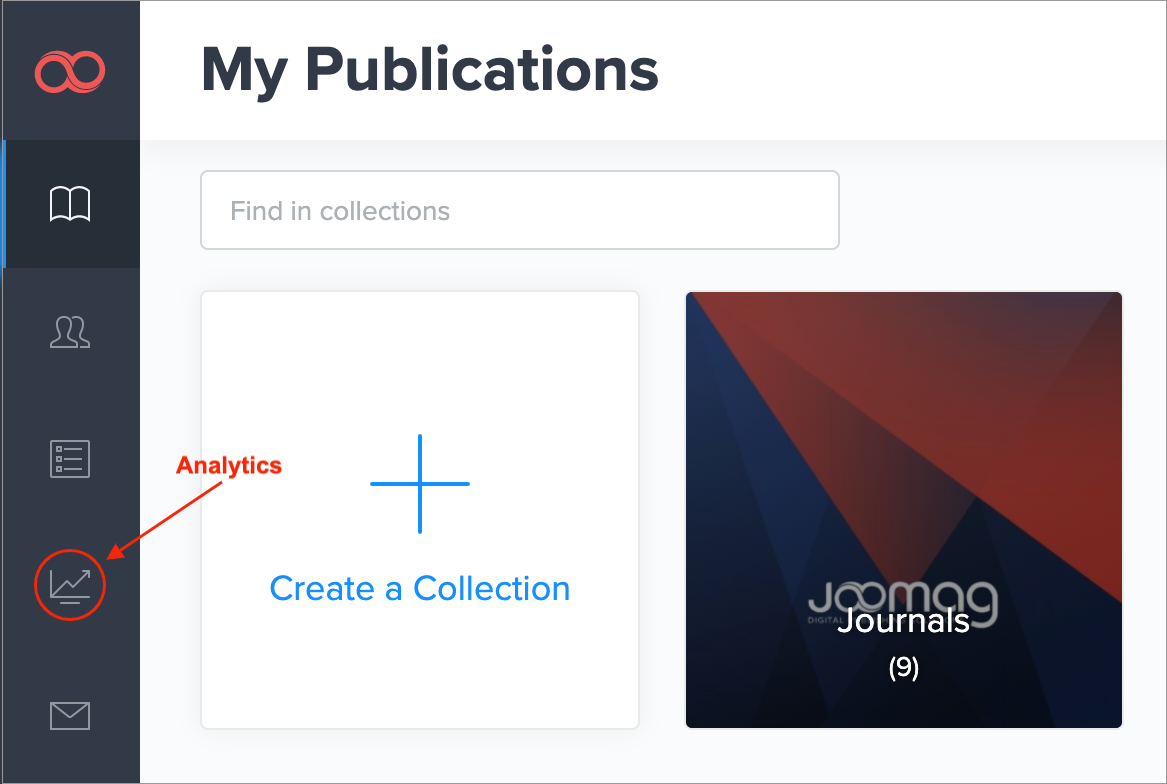
1. Navigate to Analytics on the left sidebar.
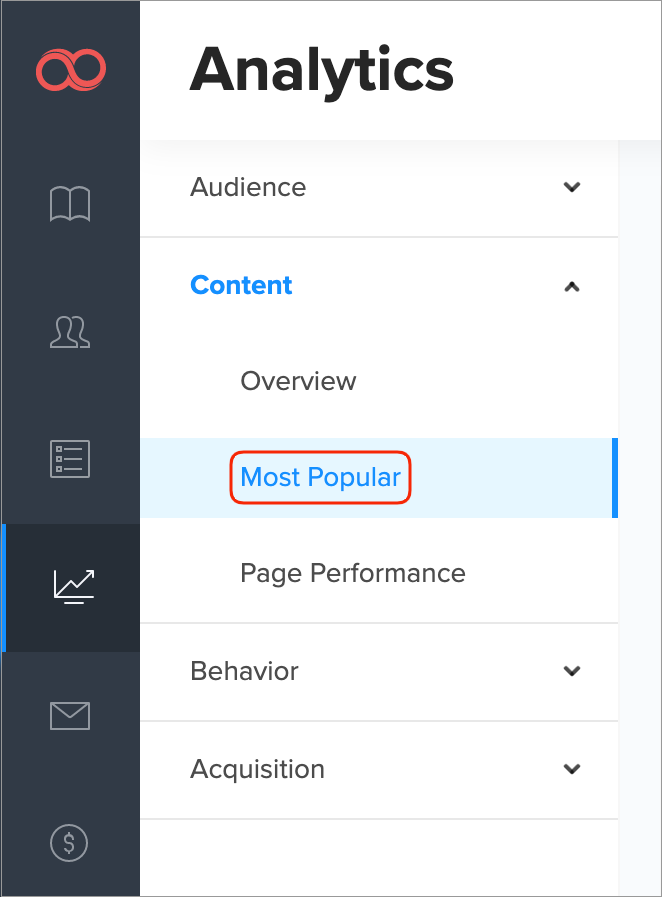
2. Use the dropdown menu on the right to select the Content section. The Most Popular section will be displayed by default.
3. Proceed to the main filters.
-
First, insert the collection name for which you wish to see the data of the most viewed publications.

-
Now, specify the date range to filter the data. You'll see the last seven days' range by default, simply click the date and choose whatever day you need.

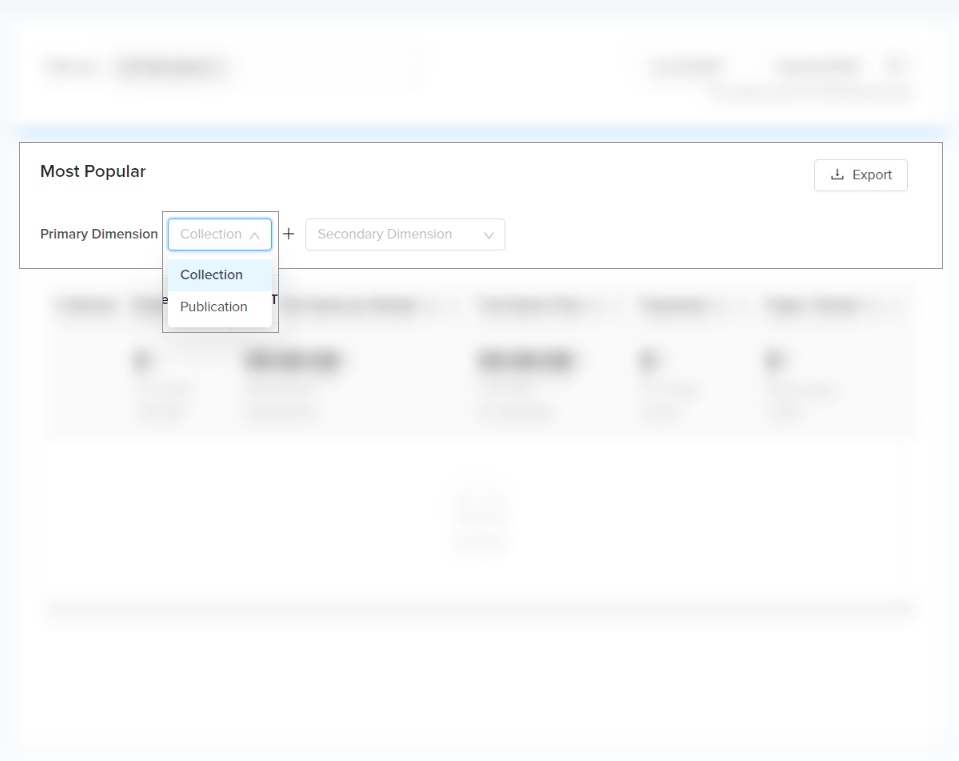
4. Choose Primary Dimensions.
Note: The Primary Dimension is Collection, which means you review the abovementioned criteria in accordance with your collections. You can click the dropdown and select Publication instead.
5. Choose a Secondary Dimension if needed.
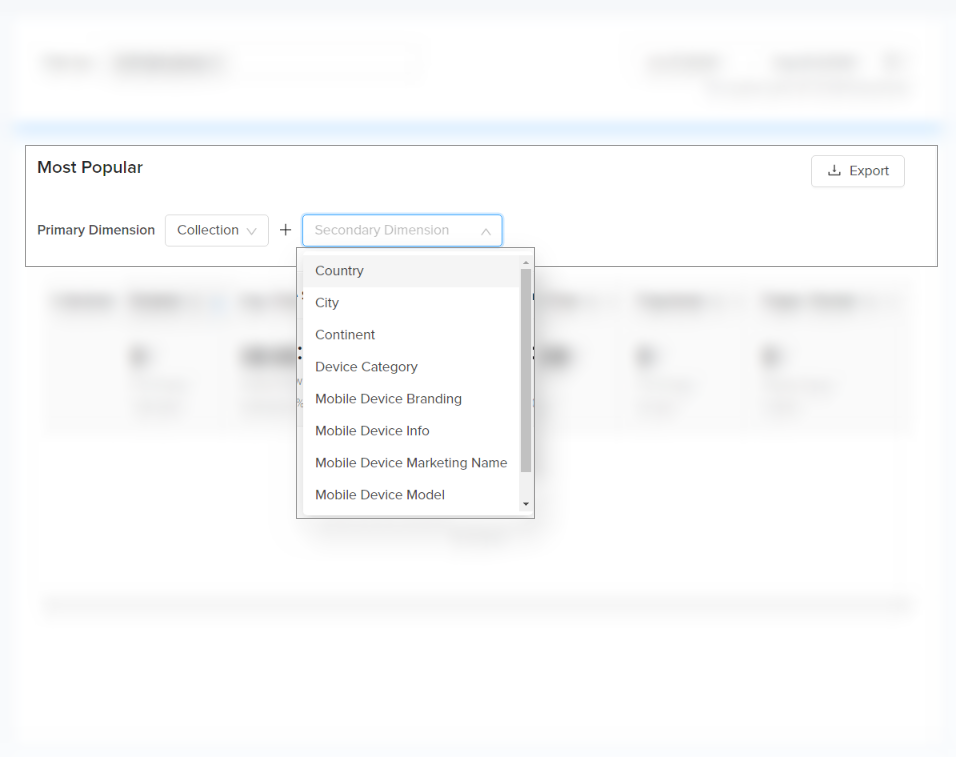
The Secondary Dimensions are as follows:
-
Country: Reader registered in this country.
-
City: Reader registered with this city.
-
Continent: Reader registered in this continent.
-
Device Category: Device type, namely Desktop, Mobile, or Tablet.
-
Mobile Device Branding: Device manufacturer or branded name such as Samsung, HTC, Verizon, etc.
-
Mobile Device Info: The exact model name of the device.
-
Mobile Device Marketing Name: The marketing name for this device, if there is any, e.g. Pearl (Blackberry)
-
Mobile Device Model: Device model, e.g. Nexus S
-
Browser: The browser used by readers to view the publication.
6. Review the most popular publication or collection according to the following criteria:
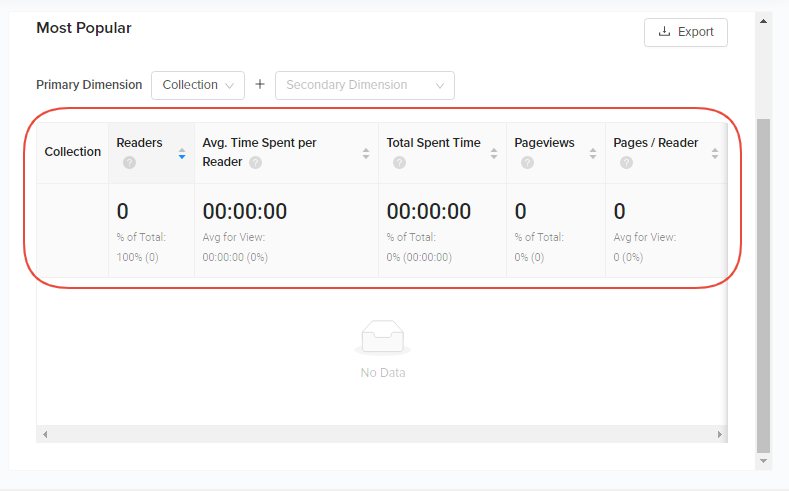
-
Readers: Readers who have initiated at least one session during the selected date range.
(Total sub-header)
-
Avg. Time Spent per Reader: The average length of viewing the specified publication per reader.
(Avg. sub-header) -
Total Spent Time: Total length of viewing the specified publication. It shows in the following format hh:mm:ss
(Total sub-header) -
Pageviews: The number of pages viewed within the specified publication. Repeated views of a single page are counted.
(Total sub-header) -
Pages / Reader: The average number of viewed pages of the specified publication by a reader. Repeated views of a single page are counted.
(Avg. sub-header)
Proceed to the other sections to get the maximum from your analytics.
💡 Learn more about our new analytics.