It may, unfortunately, happen that you come across one of the following issues: problems while editing, publications that are stuck on the loading process and etc. In such cases, the Joomag Customer Care team may ask you to send a screenshot of your browser Console while you are trying to load the page in question to identify and resolve your issue.
Now, let's see how to open the Console on all browsers:
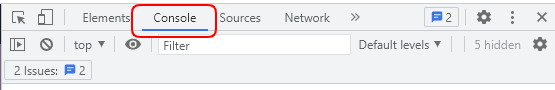
Google Chrome
Regardless of your Chrome version, you can always use the Ctrl+Shift+J hotkey on your Windows keyboard to access Console and Cmd⌘ + Option⌥ + J on Mac.
By the way, the same shortcuts can also be used to hide the Console.
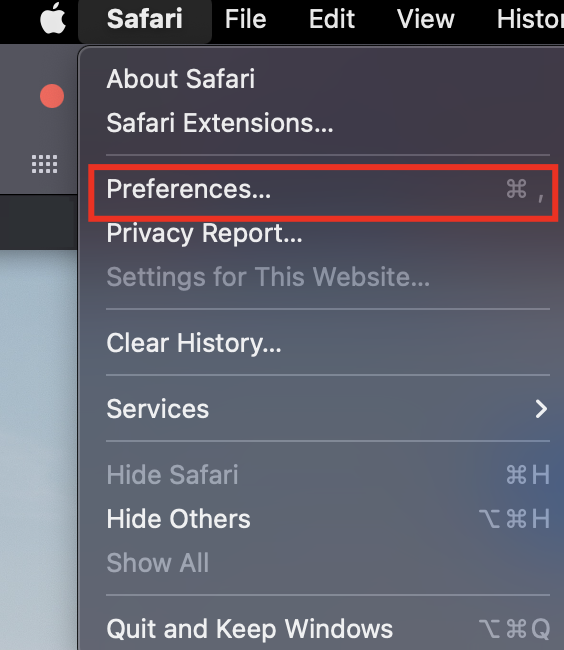
Safari
Unlike other browsers, the Error Console on Safari is disabled by default, hence, there is an extra step that needs to be performed to open it.
-
Open the Preferences... tab in your Safari browser
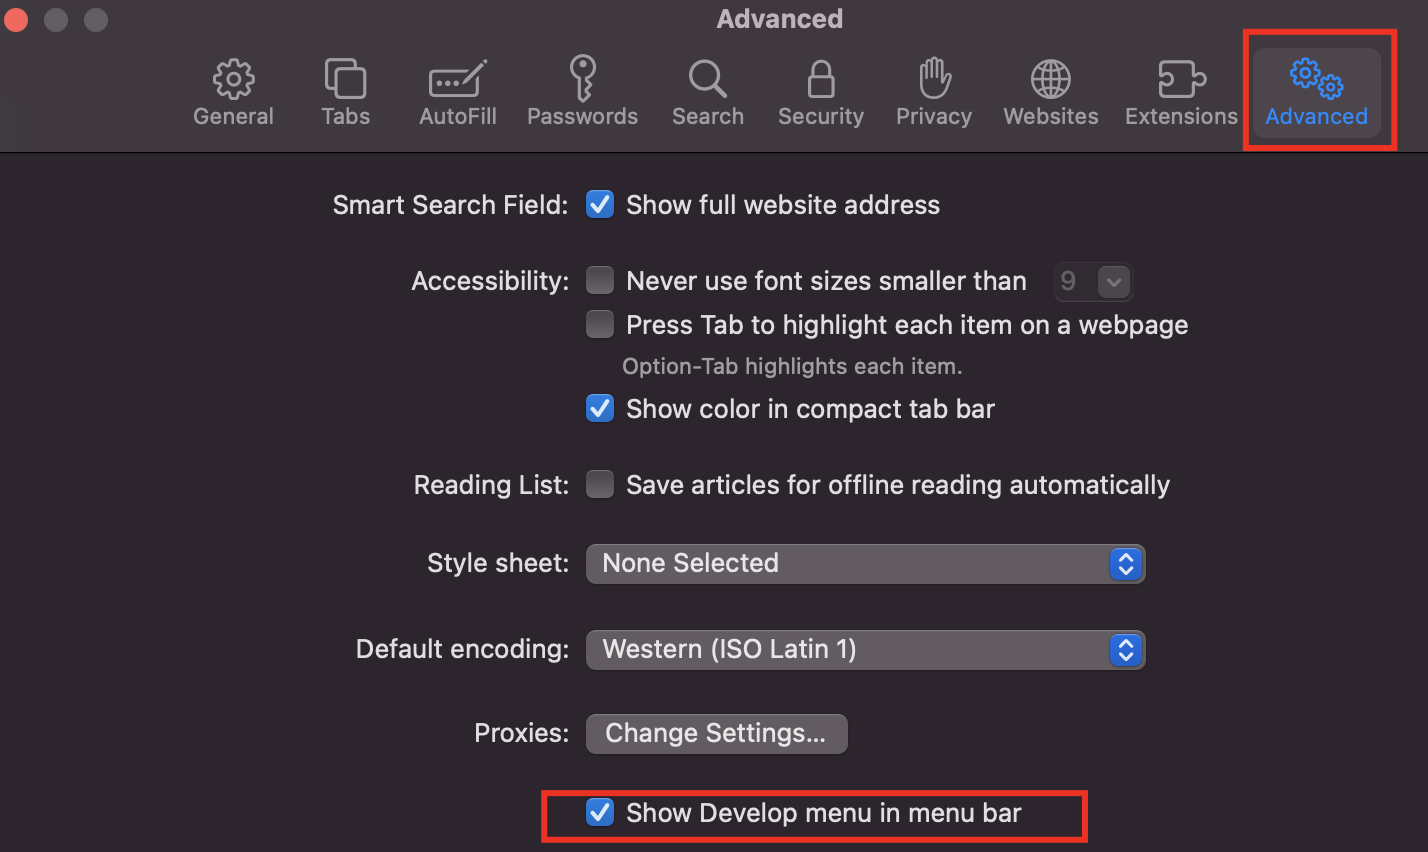
-
Click on the Advanced tab and then, check the box associated with the Show Develop menu in the menu bar
-
Now that you have made the Console visible, you can open it by accessing the Develop tab at the top and clicking on Show JavaScript Console
You can also use the shortcut Option⌥ + Cmd⌘ + C.
Mozilla Firefox
To open the Developer Console in Firefox:
-
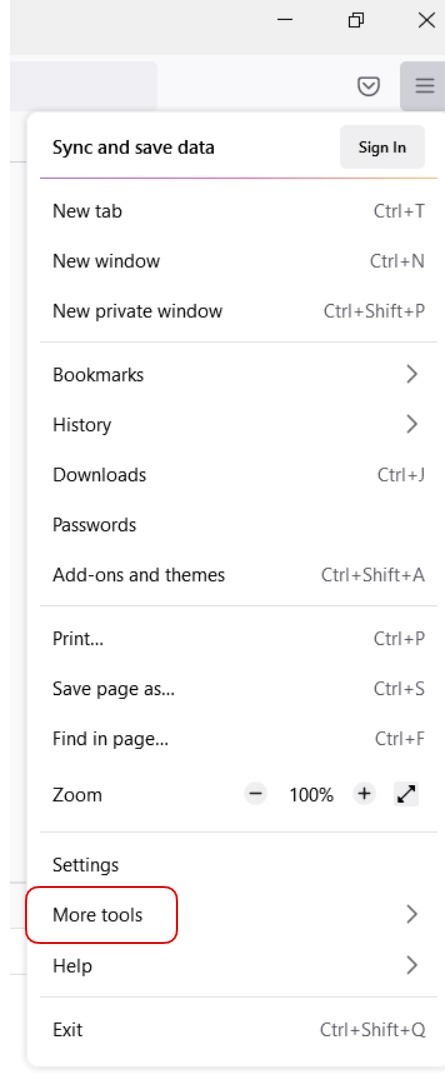
Click on Firefox Menu in the upper-right-hand corner
-
Select More Tools > Browser Console
You can also use the Ctrl + Shift + I (on Windows) and the Cmd⌘ + Shift⇧ + J (on Mac) combinations on your keyboard to open it.

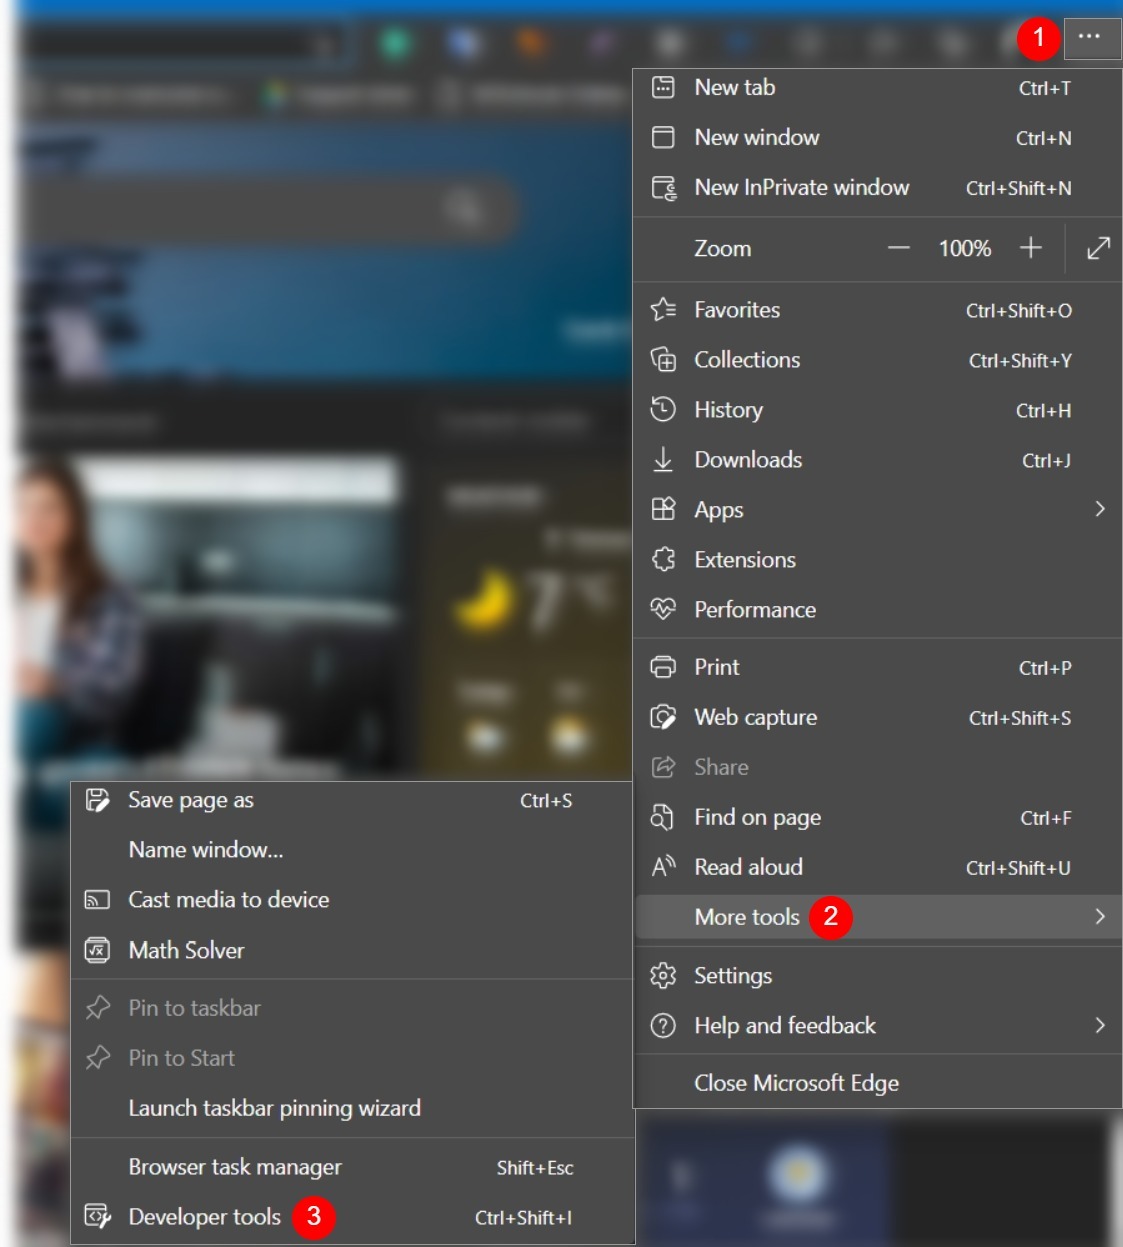
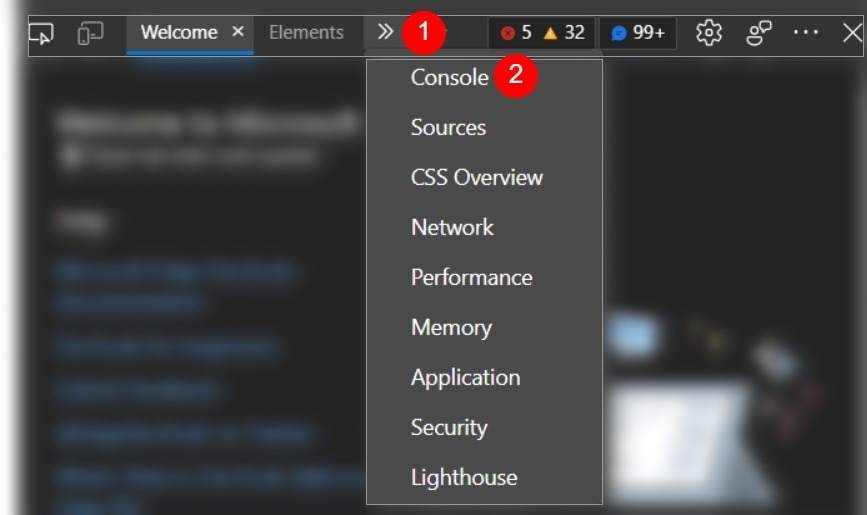
Microsoft Edge
To open the Developer Console in the Edge browser
-
Click on Edge Menu in the right-top-hand corner of the browser
-
Select More tools > Developer Tools