With Joomag's new analytics you can view pageviews and average time spent per page of your collection or publication. Here's how to do that:
Note: This feature is available with our Scale and Enterprise plans.
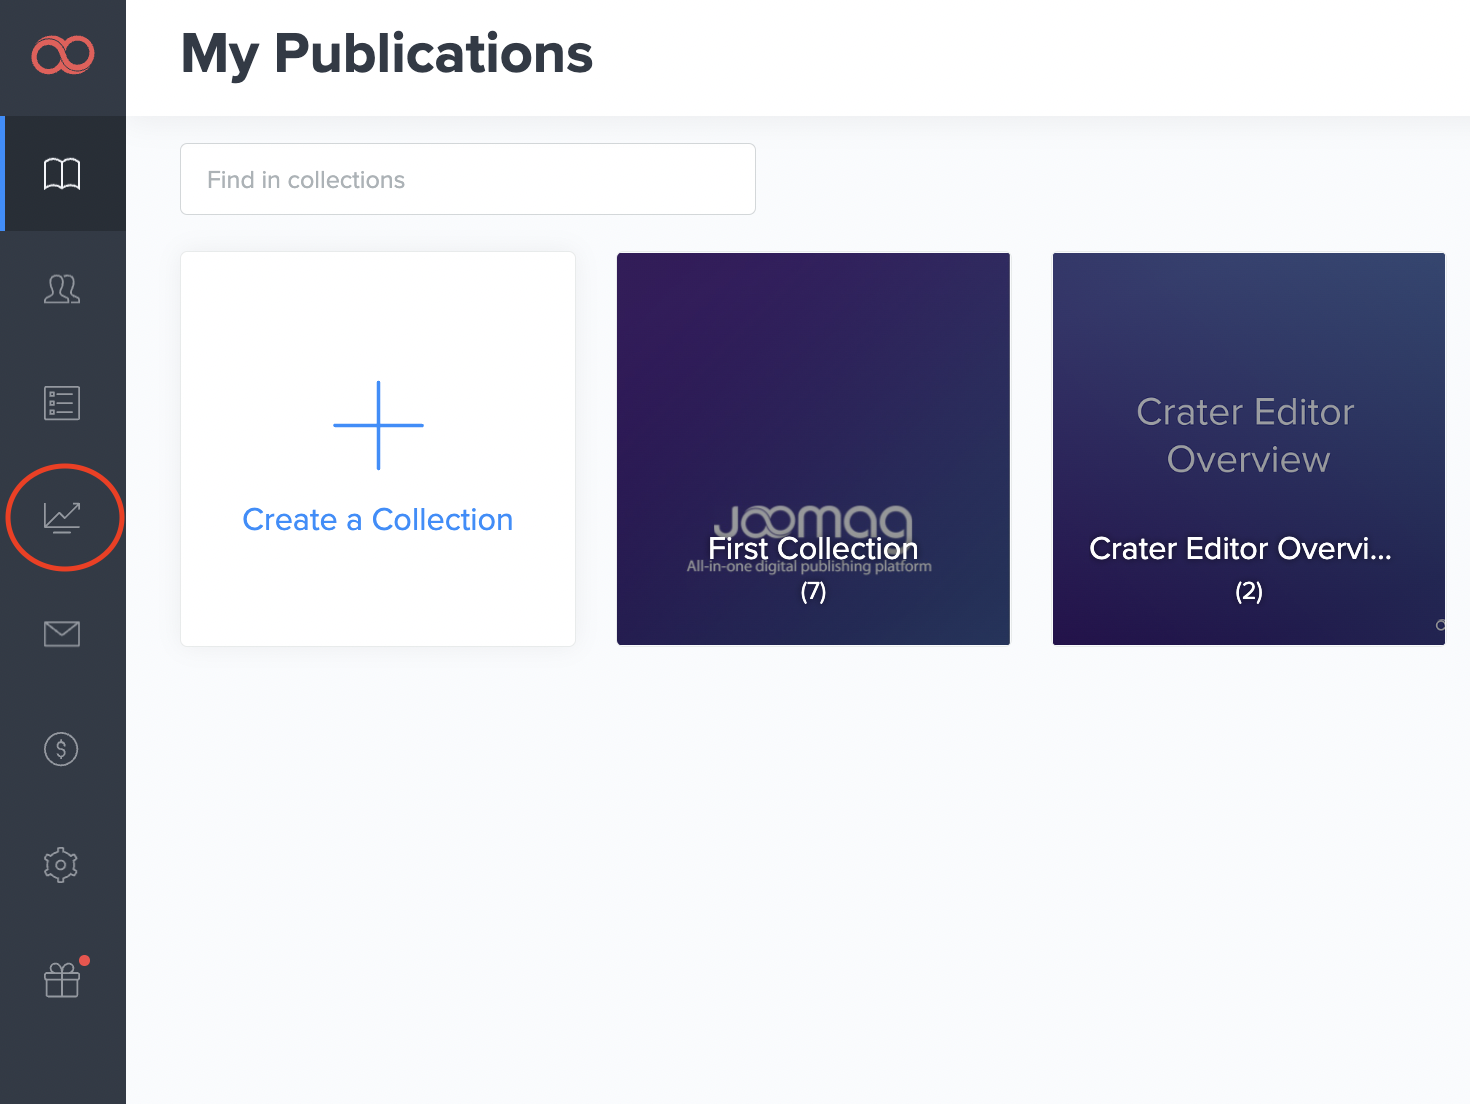
1. Navigate to Analytics on the left sidebar.
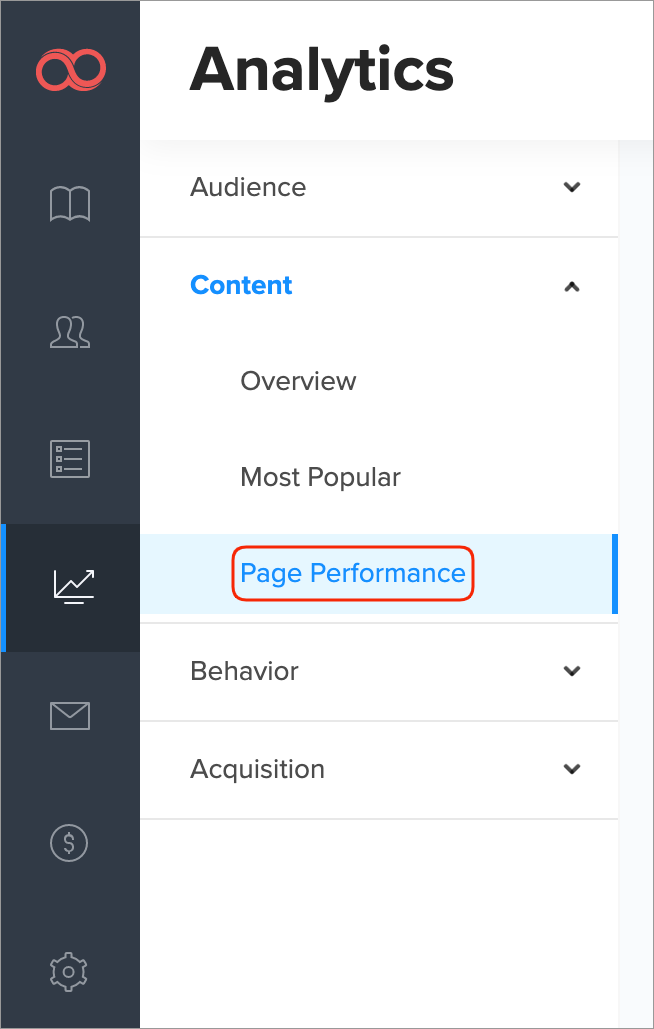
2. Use the dropdown menu on the right to select the Content section. Click on the Page Performance subsection.
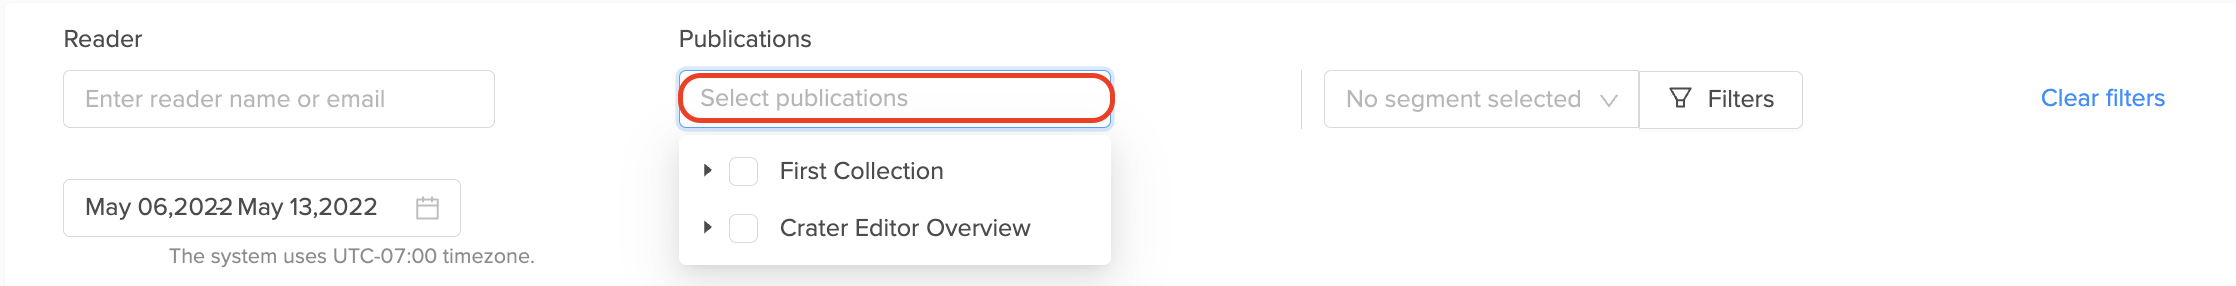
3. Proceed to the main filters.
-
First, insert the collection name for which you wish to see the performance of publications.

-
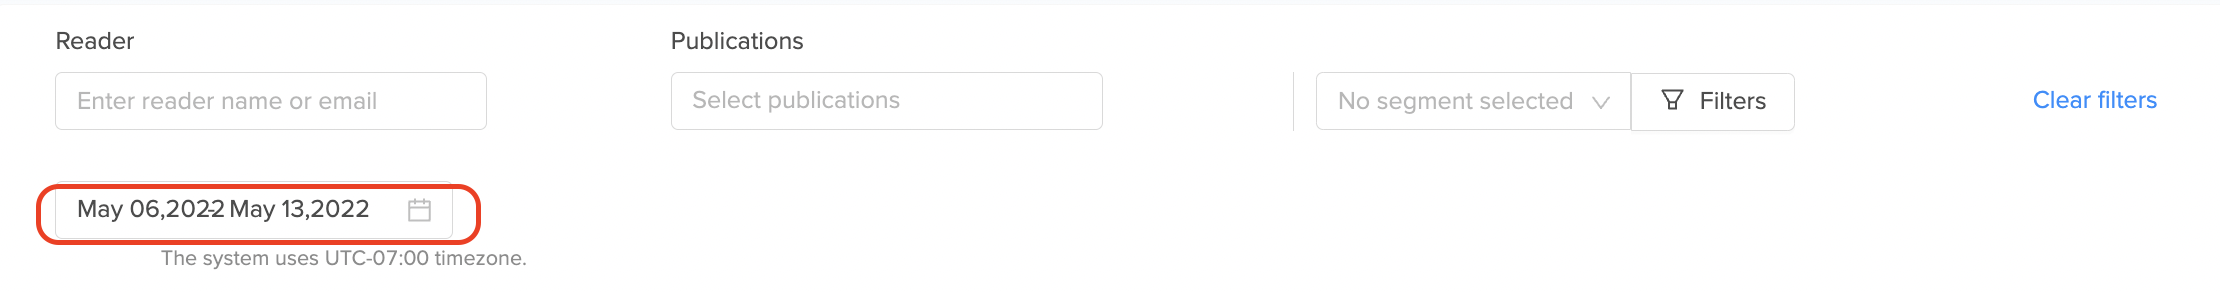
Now, specify the date range to filter the data. You'll see the last seven days' range by default, simply click the date and choose whatever day you need.

Note: If you want to check the analytics for a specific reader from your CRM you can also enter his email address in the Reader field.
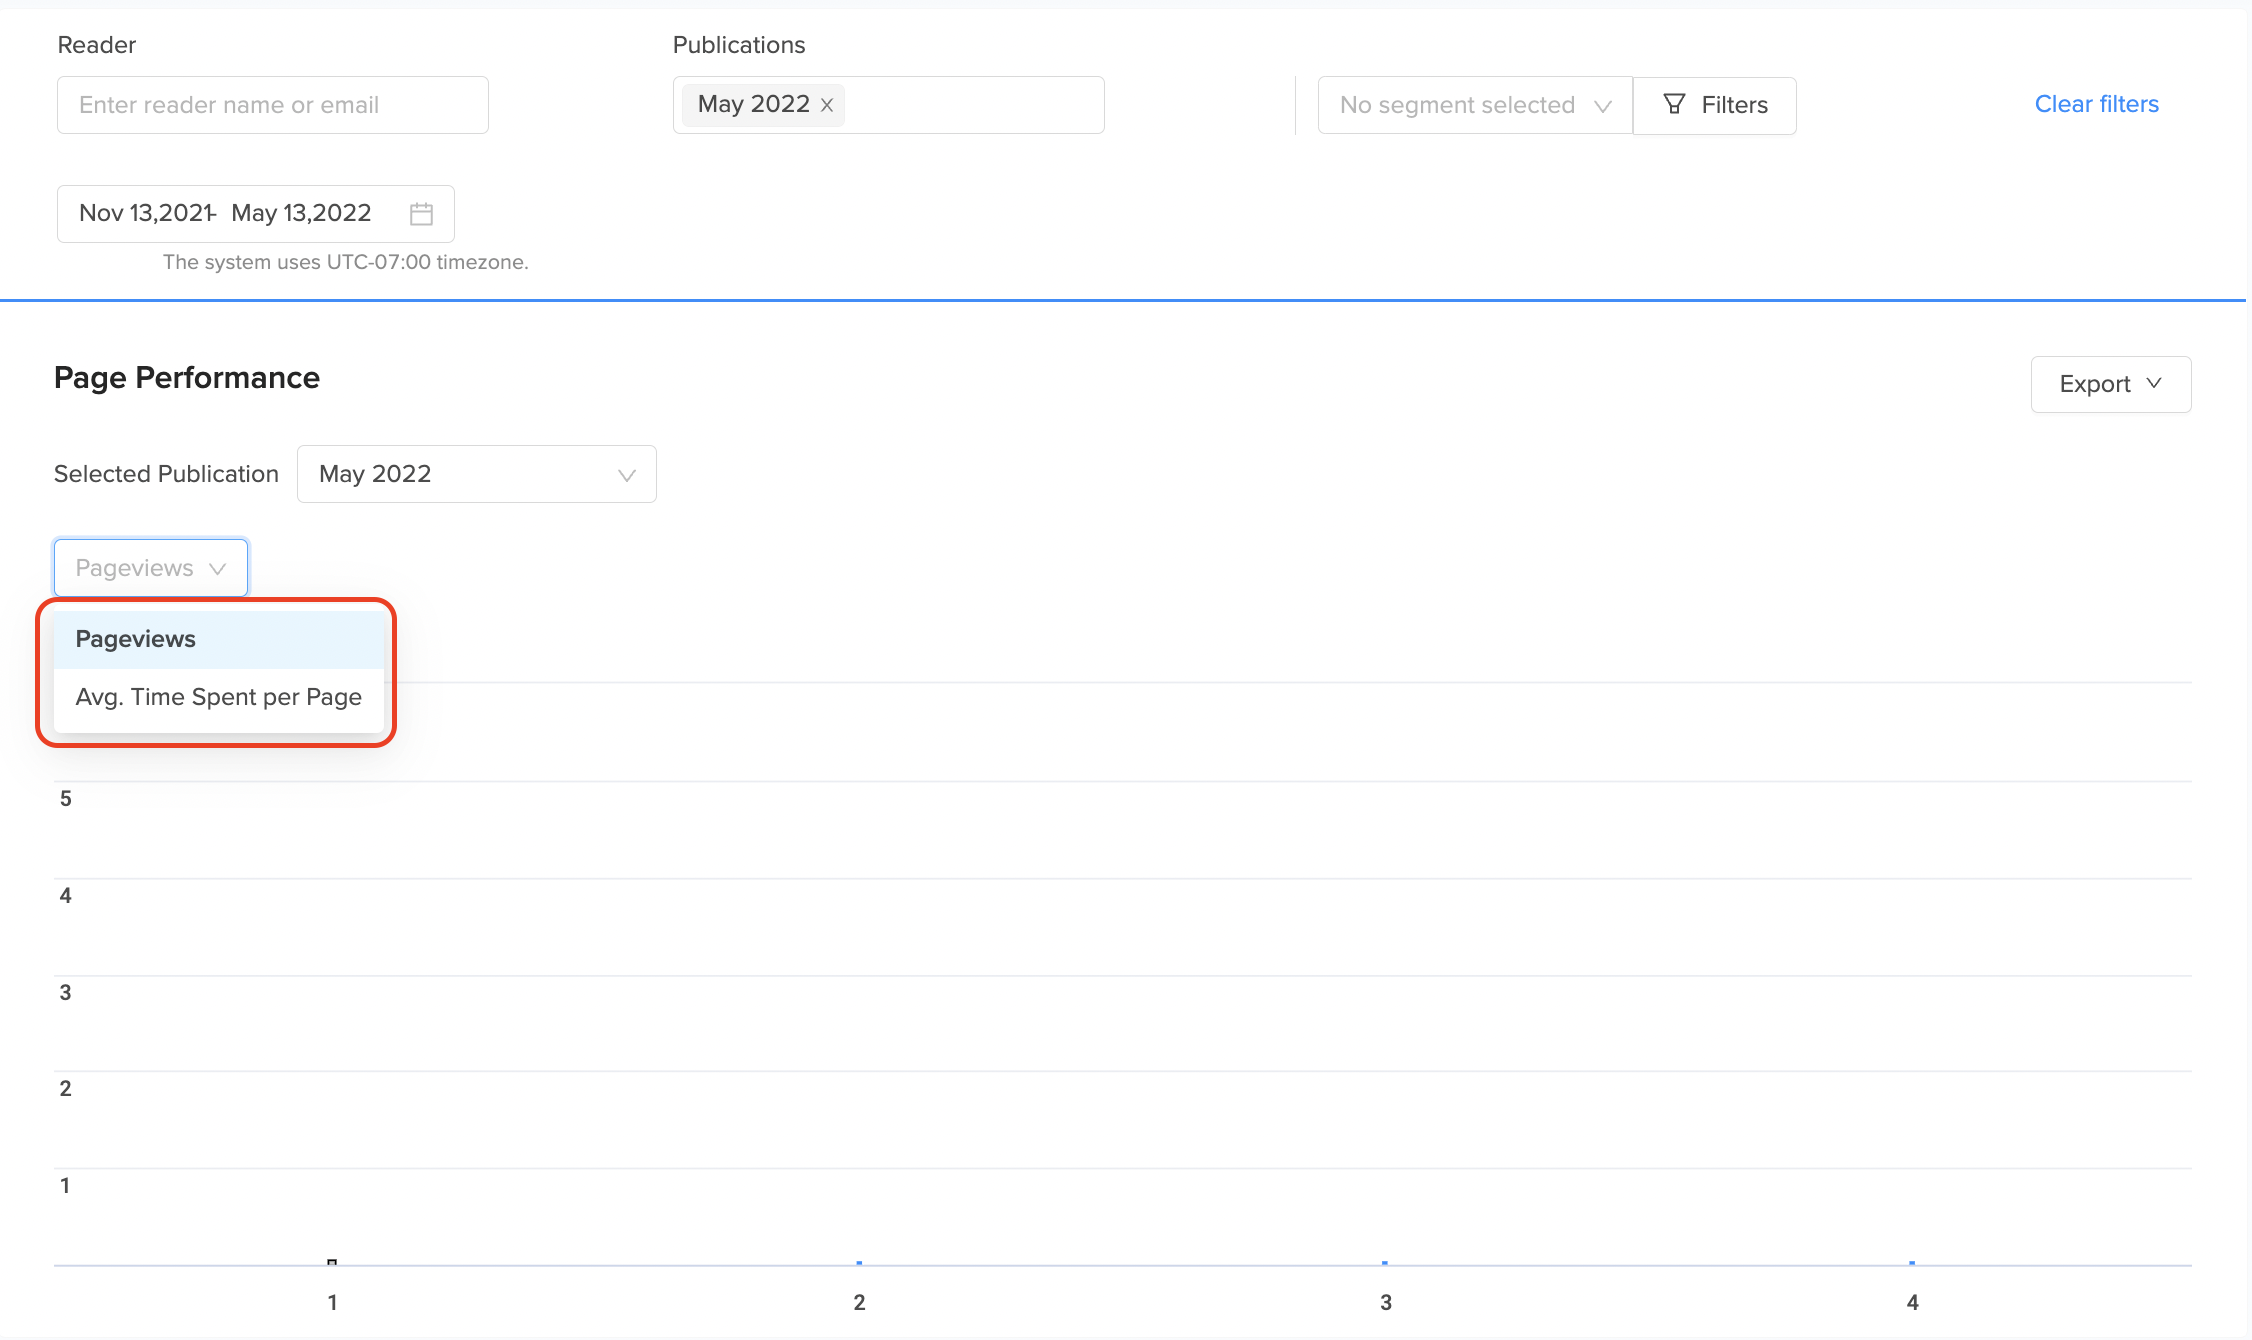
4. Select a publication.
Note: the latest publication will be selected by default.
5. Hover over the dots to see the views of a specific page. Repeated views of a single page are counted. In case the magazine is double spread it shows two pages of spread as a single column.
6. If you want to see the average time spent per page choose that section.
Proceed to the other sections to get the maximum of your analytics.
Learn more about our new analytics.