With Joomag's new analytics you receive detailed statistics on your Audience, Content, Reader Behavior, and Acquisition. The Acquisition contains several sections: Overview, Sources, Social, Referrals, Campaigns. In this article, you'll see what information the Acquisition Sources contains.
⭐️ This feature is available with our Premium plans.
To see the Acquisition Sources section follow these steps:
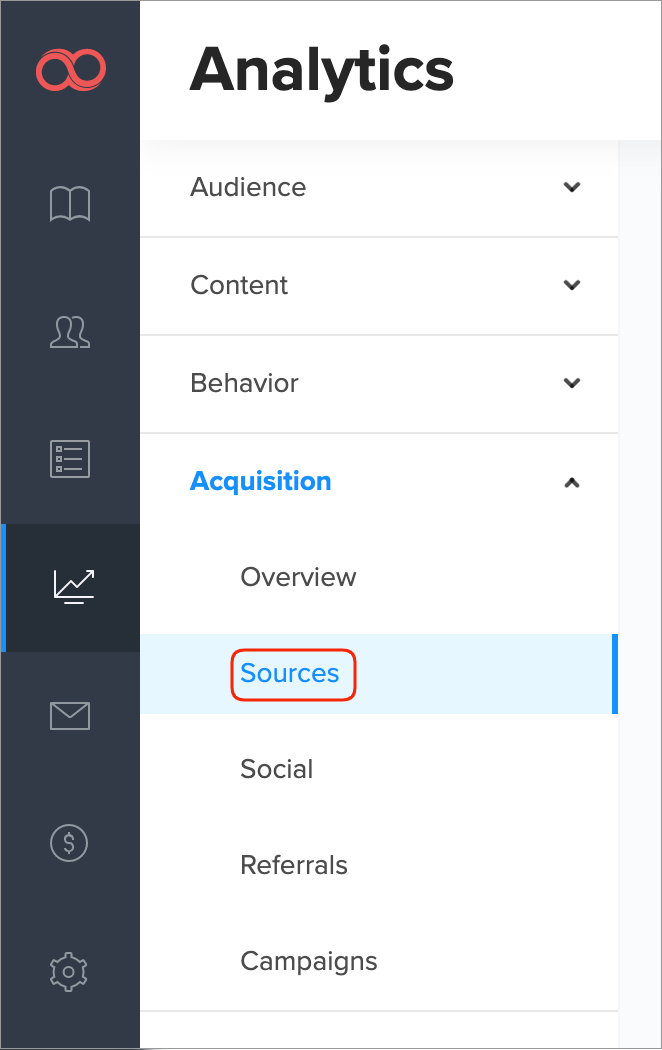
1. Navigate to Analytics on the left sidebar.

2. Use the dropdown menu on the right to select the Acquisition section. Proceed to the Sources subsection.
3. Proceed to the main filters.
-
First, insert the collection name for which you wish to see the acquisition sources.

-
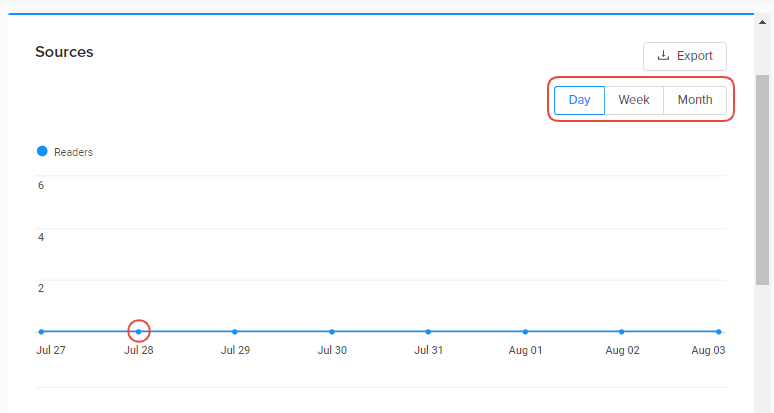
Now, specify the date range to filter the data. You'll see the last seven days' range by default, simply click the date and choose whatever day you need.

4. This chart below introduces the number of active readers. Each dot represents a day, hover over the dots to see how many active readers you have on that specific day. Use the buttons Week/Month to view the number of active readers for a broader period.
5. Scroll down to choose dimensions. Choose the Secondary dimension if needed.
Note: The Primary Dimension is Sources.
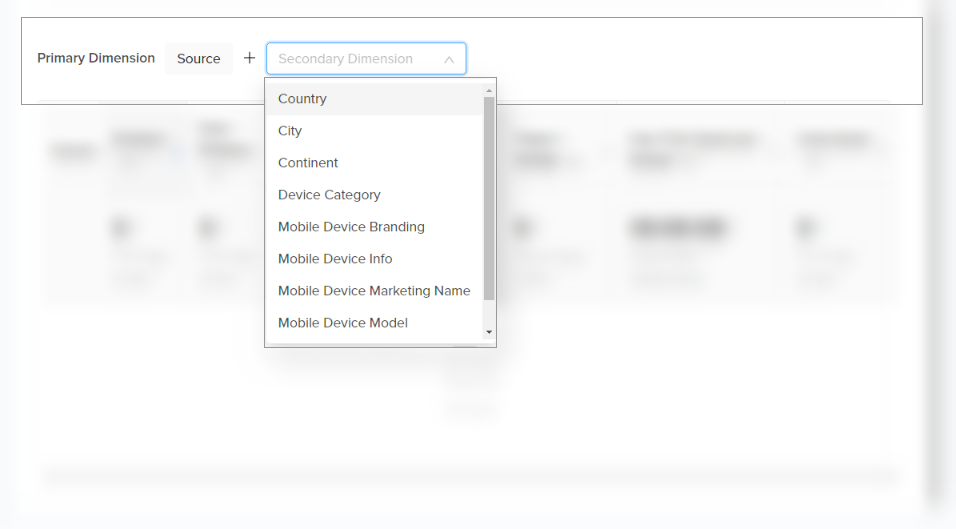
The Secondary Dimensions are as follows:
-
Country: Reader registered in this country.
-
City: Reader registered with this city.
-
Continent: Reader registered in this continent.
-
Device Category: Device type, namely Desktop, Mobile, or Tablet.
-
Mobile Device Branding: Device manufacturer or branded name such as Samsung, HTC, Verizon, etc.
-
Mobile Device Info: The exact model name of the device.
-
Mobile Device Marketing Name: The marketing name for this device, if there is any, e.g. Pearl (Blackberry)
-
Mobile Device Model: Device model, e.g. Nexus S
-
Browser: The browser used by readers to view the publication.
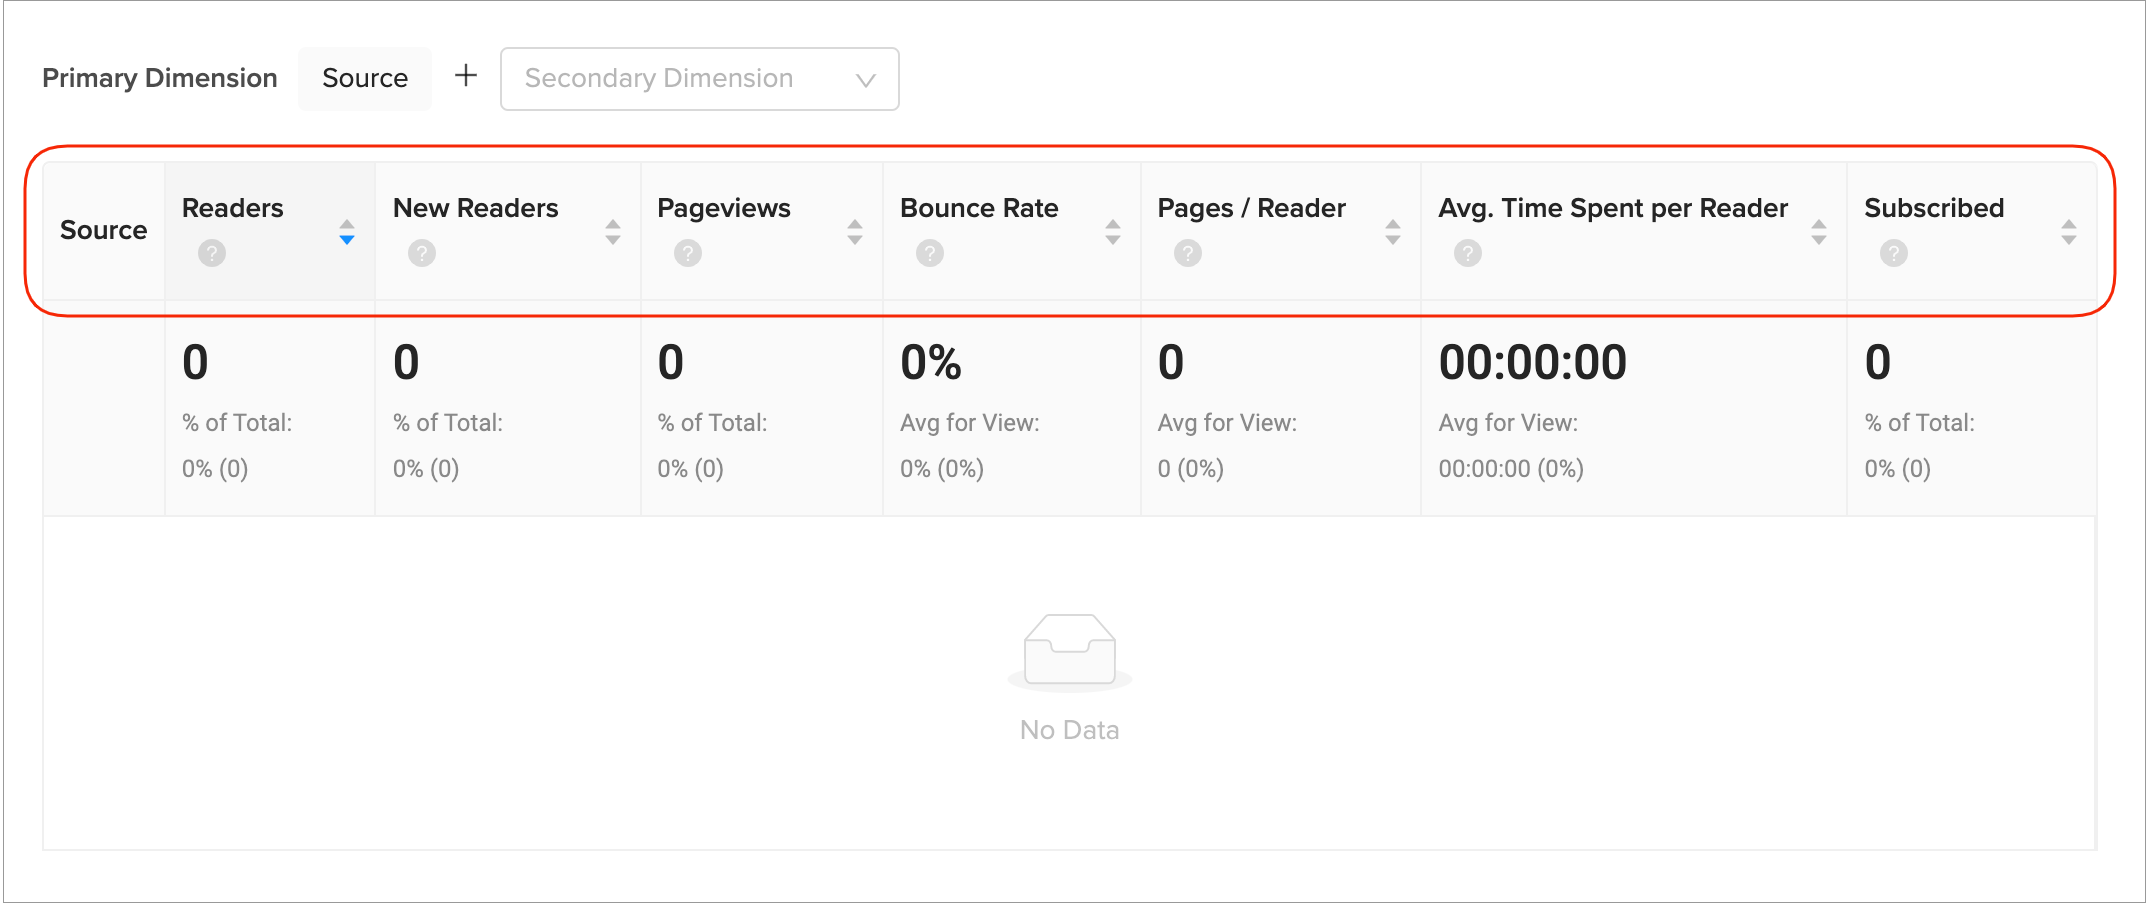
6. Review the detailed information of the acquisition sources according to the following criteria:
-
Readers: Readers who have initiated at least one session during the selected date range.
(Total sub-header) -
New readers: The number of first-time readers during the selected date range from the specified source.
(Total sub-header) -
Pageviews: The number of pages viewed by readers from the specified source. Repeated views of a single page are counted.
(Total sub-header) -
Bounce rate: The percentage of single-page readers in which there was no interaction with the page. A bounced session has a duration of less than 10 seconds.
(Total sub-header) -
Pages / Reader: The average number of viewed pages by a reader from the specified source. Repeated views of a single page are counted.
(Avg. sub-header) -
Avg. Time Spent per Reader: Average length of viewing a publication per reader from the specified source.
(Avg. sub-header) -
Subscribed: Number of readers who visited from a specific source and identified by giving email using subscribe form or plugins.
(Total sub-header)
Proceed to the other sections to get the maximum of your analytics.
Learn more about our new analytics.